
Matplotlib subplots are a plot that allows the users to plot various charts in one graph as subplots. We know that Matplotlib is a Python module commonly used for data visualization. In some cases, we may be required to plot not just a chart but subplots of charts. In such cases, we can simply use the subplots function from the Matplotlib module. Matplotlib subplots are very easy. The styling, labeling, plotting, and designing are very similar to a normal plot. The one difference is going to be the position of the graph. In subplotting, as it can contain various plots, we have to specify the position of the plot. We will take various examples to understand the positioning of charts in Matplotlib subplots.
How do you use Matplotlib subplots?
The subplot() is a function in the Matplotlib module that is used to specify the number of charts we want in our subplot. So, before starting to plot the charts, we have to let the module know how many charts we want. And then plot each chart separately.
Let us take a simple example and plot two different charts using subplots on the following dataset.
x = [1,2,3,4,5,6]
y = [2,3,2,4,3,5]
z = [2,3,2,3,5,4]
The first thing we have to do for a subplot is to specify the number of plots. In our case, we want to have two charts, so we will initialize the subplot() with 2.
import matplotlib.pyplot as plt
fig, axes = plt.subplots(2)
Output:
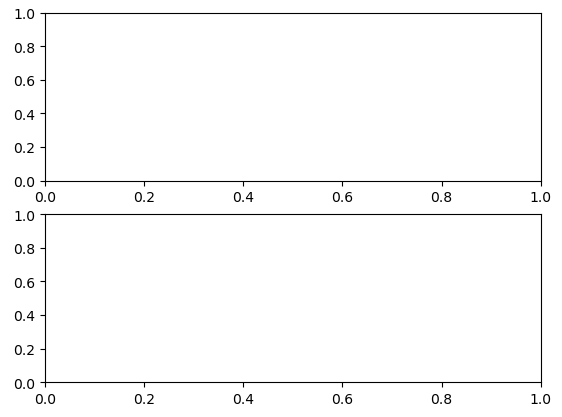
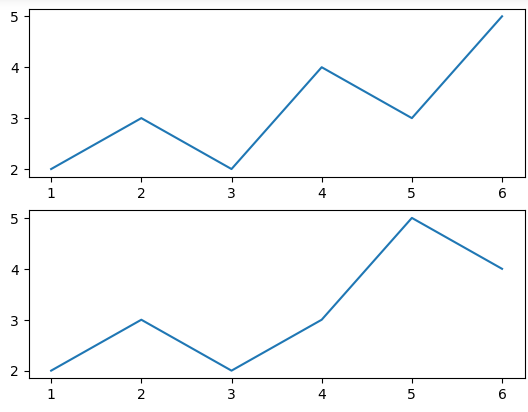
Right now, we have just created the places for the plotting. We have not started plotting the charts. In order to plot the charts, we have to specify the positions of the charts.
fig, axes = plt.subplots(2)

#first chart
axes[0].plot(x, y)

#second chart
axes[1].plot(x, z)

plt.show()
Output:
We can also specify the subplots in different columns and rows. In such a scenario, we have to specify the number of columns and rows separately. For example, we will assume that we want to have 4 charts in our subplot and the size should be 2 x 2.
fig, axes = plt.subplots(2, 2)

#first chart
axes[0, 0].plot(x, y)

#second chart
axes[0, 1].plot(x, z)

#third chart
axes[1, 0].scatter(x, y)

#fourth chart
axes[1, 1].scatter(x, z)

plt.show()
Output:

In the case of such subplots, we have to specify the column and row location when plotting the graph.
Create subplots of different sizes
So far we have seen how to plot various subplots in Matplotlib. This time, let us take it one step further and try to plot the charts with different sizes in subplotting. For this purpose, we are supposed to use the gridspec submodule from the Matplotlib module. After importing, we will specify the possible height ratio and the with ratio for each plot.
import matplotlib.gridspec as gridspec

# with 2 rows and 2 columns
gs = gridspec.GridSpec(2, 2, height_ratios=[1, 2], width_ratios=[2, 1])

# Create the first subplot
ax1 = plt.subplot(gs[0, :])
ax1.plot(x, y)

# Create the second subplot
ax2 = plt.subplot(gs[1, 0])
ax2 = plt.plot(x, z)

# Create the third subplot
ax3 = plt.subplot(gs[1, 1])
ax3.scatter(y, z)

plt.show()
Output:

Create subplots in Matplotlib with title
Adding titles to the graph is very simple and easy. In this case, we are required to give titles to each of the subplots that we will be creating. In Matplotlib, the set_title() is used to give the titles to a subplots. In the normal chart, we use the title() function but in the case of subplotting, we have to use the set_title() method.
fig, axes = plt.subplots(2)

#first chart
axes[0].plot(x, y)
axes[0].set_title("First Chart")

#second chart
axes[1].plot(x, z)
axes[1].set_title("Second Chart")

plt.show()
This will give titles to each of the subplots separately.
Create subplots with spacing
Giving spaces into the plots in Matplotlib Subplots can be done using the subplots_adjust() method. For this method, we have to specify the space we want in all 4 directions. Let us simply demonstrate it:
fig, axs = plt.subplots(2)

# Adjust spacing
plt.subplots_adjust(left=0.1, right=0.9, top=0.9, bottom=0.1)
First, we created 2 subplots. Then we used the subplots_adjust() method and gave the values for all 4 directions. You can change these values based on your plots and spaces. After this, you can simply plot the charts in the same way as we did before and you should see charts with more spaces between them.
Create Matplotlib subplots with axis labeled
In general, we use xlabel() and ylabel() methods to give the labels to the graph. But in the case of subplots, we need to use the set_xlabel() and set_ylabel() chart to plot the graph. In order to give labeling to all the charts in our subplots, we have to use these functions for each chart separately.
fig, axes = plt.subplots(2)
#first chart
axes[0].plot(x, y)
axes[0].set_xlabel("Date")
axes[0].set_ylabel("Sales")


#second chart
axes[1].plot(x, z)
axes[1].set_xlabel("Date")
axes[1].set_ylabel("New Sales")


plt.show()
This will now give labels to each of the charts separately.