If you want to have a clear and in-depth understanding of hyperparameter tuning of Catboost in Machine Learning using various methods, well here we go. We will use the custom tuning method and GridSearchCV method to find the optimum values for the parameters of the Catboost algorithm.
Catboost is the most recent boosting algorithm that can be used for classification, regression, and time series datasets. It was developed by Yandex company which is an online Taxi company and the module was made publically available in 2017. Catboost is widely used for a variety of functions, including search, recommendation systems, personal assistants, self-driving automobiles, and weather forecasting.
In this article, we will learn the important features of CatBoost, and how we can use CatBoost in Python, do hyperparameter tuning of Catboost and we will compare the CatBoost algorithm with various other boosting algorithms.
We assume that you already have been through all the boosting algorithms that we covered in the previous articles. We also assume that you have strong command over decision trees and random forests algorithms because the CatBoost uses decision trees as weak learners.
What is the CatBoost algorithm in Machine Learning?
As we discussed, the CatBoost algorithm is a supervised machine learning algorithm that can be used for classification, regression, and time series problems. It was developed by Yandex researchers and was publically made available in 2017. It has some very advanced and unique features that make it one of the fasted and most accurate boosting algorithms.
CatBoost is short for Categorical Boosting as it handles categorical values in a unique and smart way. Although CatBoost functions are similar to the Gradient boosting and XGboost methods, it has certain advanced features that make it more dependable, quick, and accurate.
Most machine learning algorithms only deal with numeric data and if we provide categorical data ( non-numeric) without label encoding, the model will return an error because it cannot understand the non-numeric values. However, the CatBoost algorithm converts the categorical values (non-numeric) to numeric values and assigned different labels for them based on the output values.
Another important feature of the CatBoost algorithm is that it can handle NULL values automatically and we don’t need to do preprocessing steps to handle the NULL values.
The last but not least feature that makes the CatBoost algorithm unique and fast is that it uses binary symmetric decision trees as weak learners.
How to Implement CatBoost in Python?
We will use the following simple steps to implement the CatBoost in Python.
- We will install the CatBoost on your system using the pip command.
- We will import the dataset and the CatBoost model.
- Next, we will split the dataset into the testing and training parts, so that we can use the training part to train the model and then use the testing part to test the performance of the model.
- One of the most important parts of ML model development is evaluating the model. We will use various methods to evaluate the model based on its predictions.
- Finally, if the model is not properly trained, we will use the hyperparameter tuning method to find the optimum values for the parameter.
Solving a Classification Problem Using CatBoost in Python
Now, we will use the CatBoost algorithm to solve a classification problem. Similar to other boosting algorithms, we will again use the iris dataset as a sample dataset to understand the implementation of the CatBoost in Python on a classification dataset. The dataset contains information about three different types of flowers.
Before going to the implementation part, make sure that you have installed the following Python modules, we will be using them in the implementation part.
- CatBoost
- Sklearn
- pandas
- NumPy
- matplotlib
- seaborn
Let us now load the dataset and print out a few rows.
# importing the required modules
from sklearn import datasets
import pandas as pd
import numpy as np

# loading the iris dataset
dataset = datasets.load_iris()

# converting the data to DataFrame
data = pd.DataFrame(data= np.c_[dataset['data'], dataset['target']],
                     columns= dataset['feature_names'] + ['target'])

# printing the few rows
data.head()
Output:
sepal length (cm)	sepal width (cm)	petal length (cm)	petal width (cm)	target
0	5.1	3.5	1.4	0.2	0.0
1	4.9	3.0	1.4	0.2	0.0
The dataset contains 4 input variables and then a target class.
Splitting the Dataset to testing and training parts
We will now split the dataset into testing and training parts so that we can use the training part to train the CatBoost model and then use the testing dataset to evaluate the performance of the model. We will also assign value 1 to the random state.
# splitting the dataset into input and output
Input = data.drop('target', axis=1)
Output =data['target']

# importing the module
from sklearn.model_selection import train_test_split

# splitting into testing and training parts
X_train, X_test, y_train, y_test = train_test_split(Input, Output, test_size=0.30, random_state=1)
As you can see we have assigned 30% of the dataset to the testing part and 70% of the dataset to the training part.
Training CatBoost Classifier in Python
Now, our dataset is ready. The next step is to initialize the CatBoost classifier and train the model using the training dataset.
# importing the CatBoot classifier
from catboost import CatBoostClassifier

# initializing the CatBoost classifier
CatBoost_clf = CatBoostClassifier()

# training the catboost classifier model
CatBoost_clf.fit(X_train, y_train)
Once, the training of the CatBoost classifier is complete, we can then use the testing dataset to make predictions.
# making predictions
catboost_pred = CatBoost_clf.predict(X_test)
In order to know how well the model has performed, we will use various evaluation matrices.
Evaluating the Performance of the CatBoost Classifier in Python
First, let us visualize the predictions and the actual values using the confusion matrix. A confusion matrix in machine learning is a matrix that shows us the actual and predicted values which helps us to see which class has been misclassified by the algorithm.
# importing modules
import matplotlib.pyplot as plt
from sklearn.metrics import confusion_matrix, ConfusionMatrixDisplay

# confusion matrix plotting
cm = confusion_matrix(y_test, catboost_pred, labels=CatBoost_clf.classes_)

# labelling
disp = ConfusionMatrixDisplay(confusion_matrix=cm, display_labels=CatBoost_clf.classes_)
disp.plot()
plt.show()
Output:
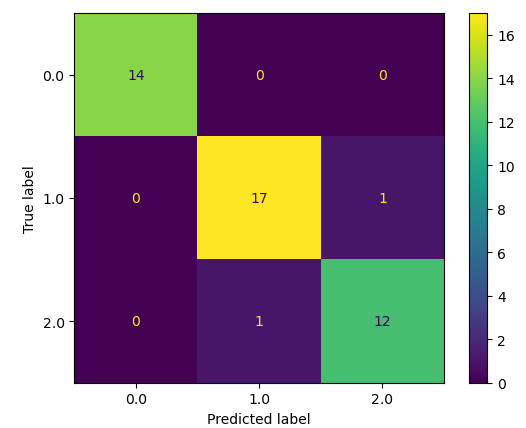
Only two predictions were incorrectly classified by the model while the rest were classified correctly. Let us also calculate the accuracy score of the model.
# importing the module
from sklearn.metrics import accuracy_score

# printing
print("The accuracy is: ", accuracy_score(y_test, catboost_pred))
Output:
The accuracy is 0.95555555
Solving Regression problems Using Catboost Regressor in Python
A regression problem is a dataset that contains continuous values as the target values. In this section, we will use the price of houses as a regression dataset and use the CatBoost regressor to predict the prices.
Let us first import the dataset and print out a few rows.
# importing dataset
data = pd.read_csv('house.csv')

# heading of the dataset
data.head()
Output:
number_of_rooms	floor	area	latitude	longitude	price
0	1	1	58.0	38.585834	68.793715	330000
1	1	14	68.0	38.522254	68.749918	340000
2	3	8	50.0	NaN	NaN	700000
As you can see, the dataset contains some null values as well and we don’t need to handle them in the preprocessing step as the CatBoost will handle them automatically.
Split the Dataset for Catboost Regressor
Now as we did earlier, we will split the dataset into testing and training parts so that we can train and then test the model.
# input and output variables
Input = data.drop('price', axis=1)
Output = data.price

# importing the module
from sklearn.model_selection import train_test_split

# splitting into testing and training parts
X_train, X_test, y_train, y_test = train_test_split(Input, Output, test_size=0.25)
We have assigned 25% of the dataset to the testing part and 75% to the training part.
Training the CatBoost Regressor in Python
Let us now initialize the CatBoost regressor and then use the training dataset to train the model.
# importing the CatBoot Regresspr
from catboost import CatBoostRegressor

# initializing the CatBoost regressor
CatBoost_rg = CatBoostRegressor()

# training the catboost Regressor model
CatBoost_rg.fit(X_train, y_train)
Once the training is complete, we can then use the testing dataset to make predictions.
# making predictions
catboost_pred = CatBoost_rg.predict(X_test)
Let us now evaluate the performance of the model.
Evaluating the Performance of the CatBoost Regressor
First, let us visualize the actual and the predicted values of the model so that it will give us a visual understanding of the predictions.
# importing the module
import matplotlib.pyplot as plt

# figure size
plt.figure(figsize=(12, 8))

# acutal values
plt.plot([i for i in range(len(y_test))],y_test, c='g', label="actual values")

# predicted values
plt.plot([i for i in range(len(y_test))],catboost_pred, c='m',label="predicted values")
plt.legend()
plt.show()
Output:
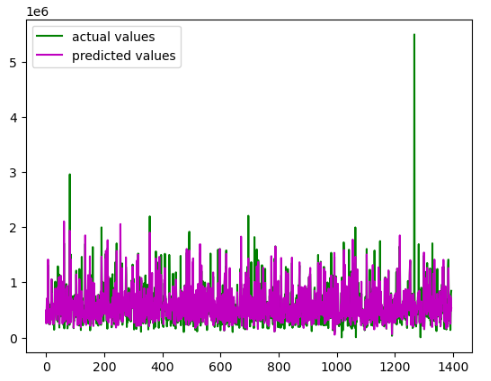
The predictions are pretty much close to the actual values. Let us also calculate the R-square score of the model.
#importing the r-square score
from sklearn.metrics import r2_score

# calculating the r score
print('R score is :', r2_score(y_test, catboost_pred))
Output:
R Score is: 0.633
As you can see, we get a pretty good score for the R-square which means the model was able to predict the price close to the actual values.
Comparing CatBoost with other boosting algorithms
Let us now compare the performance of CatBoost with other boosting algorithms that we covered in the previous articles. We will train each of these boosting algorithms on the regression dataset and then find their R-square and compare it with the R-square of the CatBoost model.
CatBoost Vs LightGBM
First, let us compare CatBoost with LightGBM which is also a popular boosting algorithm. LightGBM is also a boosting algorithm that Mircosoft Company creates. Here we will not go deep into the LightGBM but will compare the results with Catboost.
Let us import the LightGBM regressor and train the model on the training dataset.
# importing the lightGBM
import lightgbm as lgb

# initialzing the model
model_lgb = lgb.LGBMRegressor()

# train the model
model_lgb.fit(X_train,y_train)

# making predictions
lgb_pred = model_lgb.predict(X_test)
Once the training and predictions are complete, we will then visualize the predictions of the CatBoost and LightGBM models.
# figure size
plt.figure(figsize=(12, 8))

# acutal values
plt.plot([i for i in range(len(y_test))],y_test, c='g', label="actual values")

# CatBoost
plt.plot([i for i in range(len(y_test))],catboost_pred, c='m',label="CatBoost")

# LightGBM
plt.plot([i for i in range(len(y_test))],lgb_pred,label="LightGBM")
plt.legend()
plt.show()
Output:
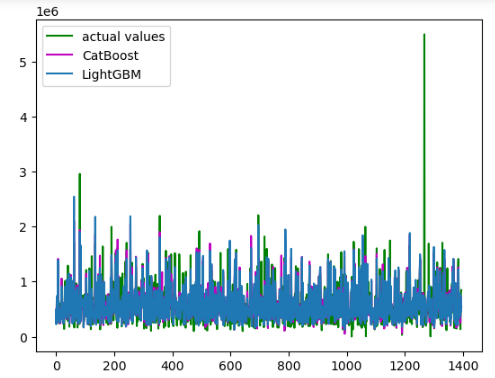
Both models have predicted the values pretty well. Let us calculate the R-square score of both models.
#  calculating the r score
print('R score of CatBoost :', r2_score(y_test, catboost_pred))
print('R score of LightGBM :', r2_score(y_test, lgb_pred))
Output:
R score of CatBoost : 0.6482586536761625
R score of LightGBM : 0.6393258220832607
The CatBoost has performed well as it has a high R-square score.
CatBoost vs XGBoost
XGBoost is also a super powerful boosting algorithm. XGBoost is also a boosting algorithm that works in a similar way as Catboost but with some different features. Here we will not discuss the XGboost in depth, we will just compare the results with Catboost.
Here we will train the XGBoost model on the regression dataset and will then compare the results with the CatBoost regressor. Let us first import the XGBoost model and train it.
# importing the module
import xgboost as xgb
# xgboost regressor
model_xgb = xgb.XGBRegressor()
# training the model
model_xgb.fit(X_train,y_train)
# making predictions
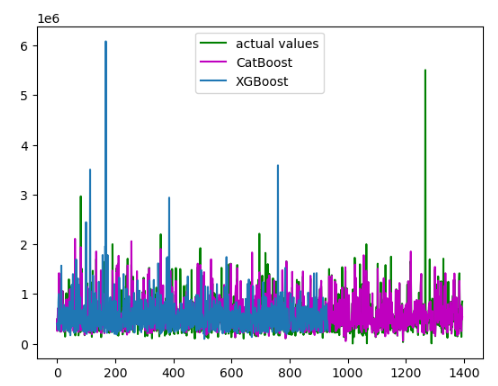
xgb_pred = model_xgb.predict(X_test)Once the training and the predictions are complete, we will again use the line plot to visualize the predictions of the XGBoost and CatBoost regressor.
Let us also calculate the R-square score of both models.
#  calculating the r score
print('R score of CatBoost :', r2_score(y_test, catboost_pred))
print('R score of XGBoost :', r2_score(y_test, xgb_pred))
Output:
R score of CatBoost : 0.6482586536761625
R score of XGBoost : 0.5588867277135894
The CatBoost has still a high R-square compared to the XGBoost model.
CatBoost vs Gradient Boosting
Gradient boosting is a simple boosting method. One of the disadvantages of the Gradient boosting algorithm is that it cannot handle the NULL values automatically so we need to preprocess the NULL values before training the model. Let us first remove, the null values and then split the dataset to train the Gradient Boosting regressor:
# null values
data.dropna(inplace=True)

# input and output variables
Input = data.drop('price', axis=1)
Output = data.price

# splitting into testing and training parts
Xtrain, Xtest, ytrain, ytest = train_test_split(Input, Output, test_size=0.25)
Now, let us import the Gradient boosting regressor and then train it on the preprocessed dataset.
# importing the regressor
from sklearn.ensemble import GradientBoostingRegressor

# training the model
GB_rgsr=GradientBoostingRegressor()

# training the model
GB_rgsr.fit(Xtrain,ytrain)

# making the predictions
GB_predict=GB_rgsr.predict(Xtest)
Once the training is complete, we will visualize the predictions.
# figure size
plt.figure(figsize=(12, 8))

# acutal values
plt.plot([i for i in range(len(y_test))],y_test, c='g', label="actual values")

# CatBoost
plt.plot([i for i in range(len(y_test))],catboost_pred, c='m',label="CatBoost")

# XGBoost
plt.plot([i for i in range(len(ytest))],GB_predict,label="XGBoost")
plt.legend()
plt.show()
Output:
As you can see, the Gradient boosting was not able to make predictions on some values, it is because we have removed all the rows that contain null values as the Gradient boosting cannot handle null values.
Let us also calculate the R-square score of both models.
#  calculating the r score
print('R score of CatBoost :', r2_score(y_test, catboost_pred))
print('R score of Gradient boosting :', r2_score(ytest, GB_predict))
Output:
R score of CatBoost : 0.6482586536761625
R score of Gradient boosting : 0.33839798712819513
Still, the Catboost is performing much better than the Gradient boosting model.
CatBoost Vs AdaBoost algorithm
AdaBoost is short for Adaptive boosting and it is considered to be the very first boosting algorithm. We assume that you already have been through the AdaBoost algorithm as we will not discuss the details here.
We will import the AdaBoost regressor and train it on the training dataset.
# importing ada boost regressor
from sklearn.ensemble import AdaBoostRegressor

# Create adaboot
Ada_regressor = AdaBoostRegressor()

# training the ada boost regressor
AdaBoost = Ada_regressor.fit(Xtrain, ytrain)

#Predict price
AdaBoost_pred = AdaBoost.predict(Xtest)
Once the training is complete, we can then visualize the predictions of CatBoost and AdaBoost regressors.
# figure size
plt.figure(figsize=(12, 8))

# acutal values
plt.plot([i for i in range(len(y_test))],y_test, c='g', label="actual values")

# CatBoost
plt.plot([i for i in range(len(y_test))],catboost_pred, c='m',label="CatBoost")

# XGBoost
plt.plot([i for i in range(len(ytest))],AdaBoost_pred,label="AdaBoost")
plt.legend()
plt.show()
Output:
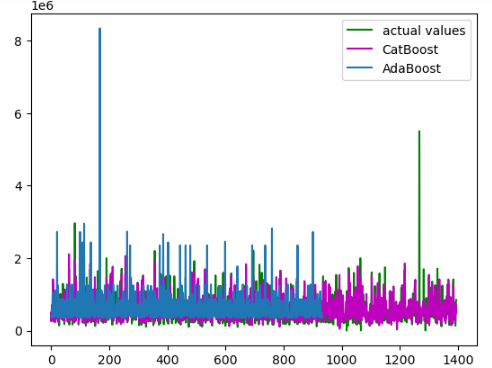
Let us now calculate the R-square of both models as well.
#  calculating the r score
print('R score of CatBoost :', r2_score(y_test, catboost_pred))
print('R score of AdaBoost :', r2_score(ytest, AdaBoost_pred))
Output:
R score of CatBoost : 0.6482586536761625
R score of AdaBoost : -0.5625015391330463
We got a negative value for the R-square score which means the model failed to follow the trend in the training dataset.
Hyperparameter Tuning of CatBoost
Hyperparameter tuning is the process of finding the optimum values for the parameters that have an impact on the overall result of the model. There are various methods and algorithms which help us to find the optimum values for the parameters. In this section, we will use various methods of hyperparameter tuning of the CatBoost algorithm.
We will not use the manual hyperparameter tuning method, instead, we will use The GridSeachCV method to find the optimum values for the parameters of the CatBoost model.
# defiing the model - Hyperparameter Tuning of Catboost
model = CatBoostRegressor()


# creating a dict of grids
grid = dict()

# values for iteration
grid['n_estimators'] = [10, 50, 100, 500]

# values for learning rate
grid['learning_rate'] = [0.0001, 0.001, 0.01, 0.1, 1.0]

# values for the sampel
grid['subsample'] = [0.5, 0.7, 1.0]

# values for teh depth of tree
grid['max_depth'] = [3, 4, 5]
As you can see, we have specified the range of values for different parameters and the GridSearchCV will find the optimum combination and will return the optimum values for the specified parameters.
Let us now use the GridSearchCV to find the optimum values.
# defining the cv - Hyperparameter Tuning of Catboost
cv = RepeatedStratifiedKFold(n_splits=10, n_repeats=3)


# applying the gridsearchcv method
grid_search = GridSearchCV(estimator=model, param_grid=grid, n_jobs=-1, cv=cv, scoring='r2')

# storing the values
grid_result = grid_search.fit(Input, Output)


# printing the best parameters - Hyperparameter Tuning of Catboost
print("Accuracy score: %f using %s" % (grid_result.best_score_, grid_result.best_params_))
This will give you the optimum values for the parameters.
NOTE: You can access the source code from my GitHub account. Please don’t forget to follow and give a start.
Summary
CatBoost is short for the categorical Boosting algorithm. It was developed by Yandex researchers and was made publically available in 2017. It has some advanced features that make it a fast and accurate boosting algorithm. It can handle null values and categorical (non-numeric) values and we don’t need to preprocess them. In this article, we discussed the CatBoost algorithm, and its main features and learn how to implement CatBoost in Python. Moreover, we also covered the hyperparameter tuning of the CatBoost algorithm.