Attributeerror: module matplotlib has no attribute subplots error occurs when you try to plot subplots in matplotlib module. Matplotlib module is a Python visualization module that can be used to plot various kinds of plots including 3d plots as well. In this short article, we will learn how we can solve attributeerror: module matplotlib has no attribute subplots error that we may face while working with matplotlib module and plotting subplots. Moreover, we will also show you a sample code on how to create different types of subplots as well.
Solve module matplotlib has no attribute subplots
Let us now figure out and solve why we are getting this error. This problem occurs when we tried to import the subplot function from the Matplotlib module. There can be multiple reasons for this error. Some of the common reasons for this error are:
- You might be using the outdated version of Matplotlib. Because the subplots function in the Matplotlib module was introduced after matplotlib 1.0 version so if you are using the older version, then you are getting this error. In the next section, we will learn how we can install the new and updated version on our system.
- You might have typo mistake in the code. So, make sure that you have correctly typed the subplots.
- There might be a conflict between different libraries that you are using along with matplotlib module. To fix this, you need to modify your imports to ensure that you are using the correction function from the library.
- Incorrect import statement: If you import Matplotlib using the wrong syntax, you may not be able to access the “subplots()” method.
Now let us see, how we can solve the issue
Installing matplotlib
As we discussed the reason for having attributeerror: module matplotlib has no attribute subplots error is because we are trying to access the function from matplotlib that does not exist. The subplots function is not available in the older version of matpltolib so, it is better to uninstall the previous version of matplotlib and install the updated version:
# uninstalling matplotlib module
pip uninstall matplotlib
Once the uninstallation is complete, you can then use various methods to install the matplotlib on your system again. Here is a list of commands you can use to install matplotlib on your system.
# using pip command
pip install matplotlib

#using pip3 command
pip3 install matplotlib

# if you are using anaconda
conda install matplotlinb

# for jupyter notebook
!pip install matplotlib
Once the installation is complete, you can run your code again, and hopefully, you will not get the error anymore.
Upgrading matplotlib module
Another way to solve the issue is to upgrade the existing matpltlib module rather than uninstalling the existing one and installing it again.
pip install --upgrade matpltolibIf you want to install a specific matpltolib version, then you can also specify it as shown below depending on your system.
#using pip command
pip install matplotlib==3.4.3

# for Python 3
pip3 install matplotlib==3.4.3

# if you don't have pip in your PATH environment variable
python3 -m pip install matplotlib==3.4.3
This should solve the issue and you should be able to run the code.
Matplotlib subplots
Sometimes the error occurs because of typo mistakes as well. So, here we will solve one problem and plot subplots using matplotlib module so that you can compare your solution with this one, and if there are any typo mistakes you can fix them.
Learn 3d visualization and 2d visualization in Python using matplotlib module.
Note that we will take examples of subplots from the official documentation of matplotib module.
# importing matplotlib module
import matplotlib.pyplot as plt

# creating dataset
data = {'apple': 10, 'orange': 15, 'lemon': 5, 'lime': 20}
names = list(data.keys())
values = list(data.values())

# plotting different subplots
fig, axs = plt.subplots(1, 3, figsize=(9, 3), sharey=True)
axs[0].bar(names, values)
axs[1].scatter(names, values)
axs[2].plot(names, values)
fig.suptitle('Categorical Plotting')
Output:
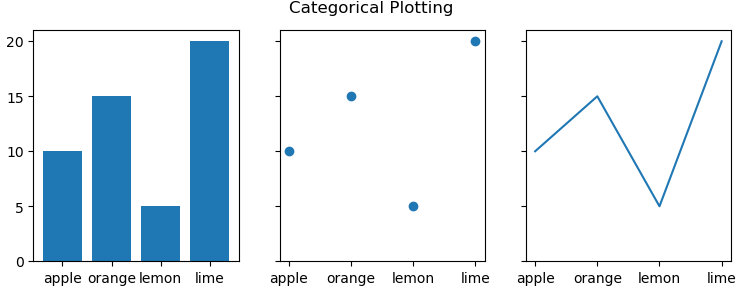
As you can see, the above Python code has created their plots using subplot method from matplotlib module.
Summary
In this short article, we learned how we can solve Attributeerror: module matplotlib has no attribute subplots error in matplotlib. We discussed two different methods to solve the problem. Moreover, we also discussed how we could plot subplots in maptlolib using an example.