Unsupervised Learning analyzes and groups unlabeled datasets using machine learning algorithms to find hidden patterns or data groupings without the assistance of a person. Algorithms for unsupervised learning are divided into two categories clustering and association rules. The k-means clustering in Python is one of the clustering methods used in machine learning which belongs to unsupervised learning algorithms. In this article, we will visualize and implement k-means clustering in Python using various Python modules. Moreover, we will learn how we can find the optimum number of clusters to train the model based on the dataset.
What is the K-means Clustering Algorithm?
One of the most popular exploratory data analysis methods used to comprehend the data structure is clustering. The clustering method is used, to find homogenous subgroups within the dataset that are comparable and similar to one another based on a similarity metric like Euclidean or correlation-based distance.
An unsupervised machine learning approach called K-means divides a dataset into K distinct, non-overlapping subgroups also known as clusters. It is also known as a centroid-based algorithm. We can divide the data into many groups or categories easily using the k-means clustering algorithm by specifying the number of clusters. For instance, there will be two clusters if K=2, three clusters if K=3, etc. The categories of groups in the unlabeled dataset may be easily found by using the K-means technique. For now, don’t get confused about K. It is a parameter value that defines the number of clusters. We will discuss it later in the upcoming sections.
The goal of the K-means algorithm is to associate each cluster with its centroid while minimizing the sum of distances between the data points and their respective clusters. Here are some of the key features of the k-means clustering algorithm.
- Iteratively determines the best value for centroids (center points for every K’s cluster)
- Assigns each data point to its closest K-center. The nearest K-center data points form a cluster
How Does the K-means Clustering Algorithm Work?
The k-means clustering algorithms work
- Define the number of clusters based on the provided K value
- Select random K points or centroids
- Form the K clusters by assigning each data point to their closest centroid
- Calculate the variance and define a new centroid of each cluster
- Repeat the process from the third step to reassign each data point to the new closest centroid of each cluster until the algorithm finds the best possible solution using the following steps.
Let us now understand the working of the k-means clustering algorithm step by step. Let us assume that we have the following dataset.

The very first step in K-means clustering is to define the K value. As we discussed earlier that K is a parameter value and we should define it. For simplicity, in this section, we will take the value of K as 2. So, the algorithm will choose random points K ( in our case 2) for each centroid to form the cluster. These points can be either the points from the dataset or any other points. Let’s say the algorithm selects the following two centroids:
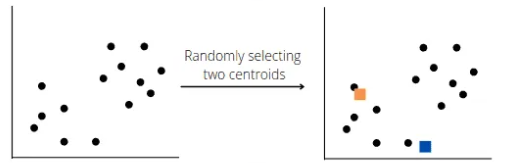
The orange square shows the randomly selected centroids for clusters by the model. Now the model will calculate the distance between each data point and its nearest centroid to identify the median between two clusters:
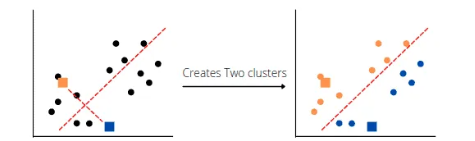
Two clusters had been created based on the randomly selected centroids. The K-means clustering algorithm then selects new centroids based on the estimated centers of gravity for each cluster, reassigns each datapoint to the new centroid, and determines a median for the new clusters. For example, in our case, the new center will be shifted more toward the dense data points.
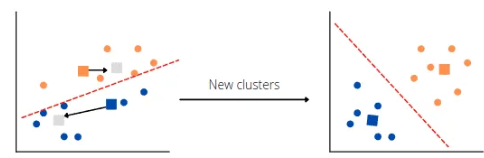
The process of changing the position of centroids will continue unless it finds the optimum clusters.
What is the Elbow Method in K-means Clustering?
The number of clusters has a significant impact on the efficacy of the K-means clustering algorithm, and selecting the right value for K is crucial but it is time-consuming if we start training the model with different numbers of clusters. However, the elbow method solves this problem. The Elbow method uses the Within Cluster Sum of Squares (WCSS) value to define total variations.
Read more about LightGBM and Hyperparameter tuning.
The simplest way to understand the elbow method is to visualize it. The sharp point of bend or a point of the plot that looks like an arm is the best value for K. One of the limitations of the elbow method is that it does not work always, especially when the data is categorical.
When to Apply the K-means Clustering Algorithm?
It is always better to apply the k-means clustering in Python on the dataset that is distributed randomly and there are no defined output classes. The problem that k-means clustering can arise when applied to categorical output values is that some of the categorical values can be misplaced in different clusters.
It is always recommended to apply the K-mean clustering model on the dataset which has continuous values and the values are randomly distributed.
Implementing K-means Clustering in Python
So far you get the basic knowledge about k-means clustering. Now, it is time to implement the concept in Python and visualize the clusters using Python language. Before going to the implementation part, make sure that you have already installed the following Python modules as we will be using them in the implementation.
- sklearn
- numpy
- pandas
- matplotlib
- plotly
We will use these modules in the implementation part.
First, let us import the dataset and print a few rows in order to get familiar with the type of dataset.
# import pandas
import pandas as pd

# importing dataset
dataset = pd.read_csv("k-mean-data.csv")

# printing the info about dataset
dataset.head()
Output:
CustomerID	Genre	Age	Annual Income (k$)	Spending Score (1-100)
0	1	Male	19	15	39
1	2	Male	21	15	81
2	3	Female	20	16	6
3	4	Female	23	16	77
4	5	Female	31	17	40
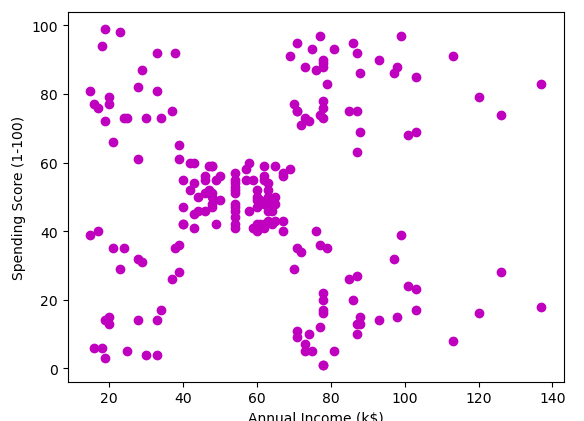
As we discussed earlier that k-means clustering in Python works better when the data is more dispersed rather than categorical. For that purpose, we will take only two attributes of our dataset. We will train the model on the annual income and spending score column. But first, let us visualize the data points.
# creating new dataset of only two columns
data = dataset.loc[:, ['Annual Income (k$)', 'Spending Score (1-100)']]

# importing the module
import matplotlib.pyplot as plt

# image size
plt.figure(figsize=(10,5))

# ploting scatered graph
plt.scatter(x= data['Annual Income (k$)'], y=data['Spending Score (1-100)'], c='m')

# labeling the axies
plt.xlabel('Annual Income (k$)')
plt.ylabel('Spending Score (1-100)');
Output:
K-means Clustering With 2 clusters
As an example and for simplicity, we will train the k-means clustering model on 2 clusters. First, we will import the k-means clustering in Python and then initialize the model with 2 clusters.
# importing the k-means
from sklearn.cluster import KMeans

# initializing k-means clustering in Python with two clusters
km = KMeans(n_clusters = 2)

# training the k-means clustering in Python
km.fit(data)
Once the training is complete, we can then visualize the clustering using matplotlib module.
# ploting the graph of the clusters
plt.figure(figsize=(10,5))
plt.scatter(x= data.iloc[:, 0], y=data.iloc[:, 1], c= km.labels_)
plt.xlabel('Annual Income (k$)')
plt.ylabel('Spending Score (1-100)');
Output:
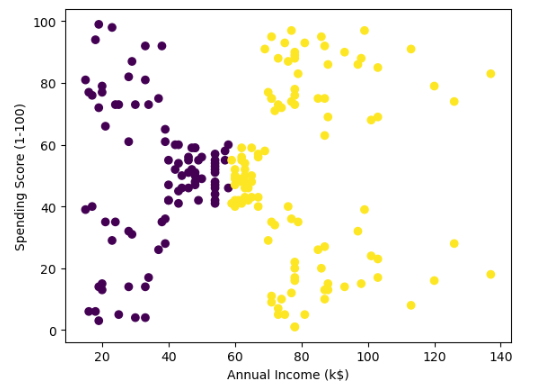
The model has split the dataset into two clusters. One another parameter of k-means clustering in Python is the random state. It has a great impact on the formation of clusters. For example, if we will change the random state, the formation of clusters will be different. Let us verify it using different random states for the model. We will use subplots to show the differentiations.
# ploting in line plots
fig, ax = plt.subplots(1, 2, gridspec_kw={'wspace': 0.3}, figsize=(15,5))

# k-means clustering in Python
for i in range(2):
    km = KMeans(n_clusters = 2, init='random', n_init=1, random_state=i)
    km.fit(data)
    ax[i].scatter(x= data.iloc[:, 0], y=data.iloc[:, 1], c= km.labels_);
Output:
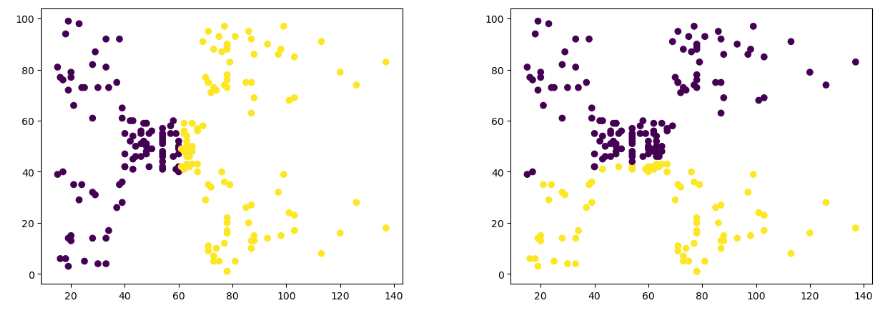
As you can see how the random state affects the plotting of the clusters. So, while training the model, make sure that you have a constant value for the random state.
How to Evaluate K-means Clustering in Python?
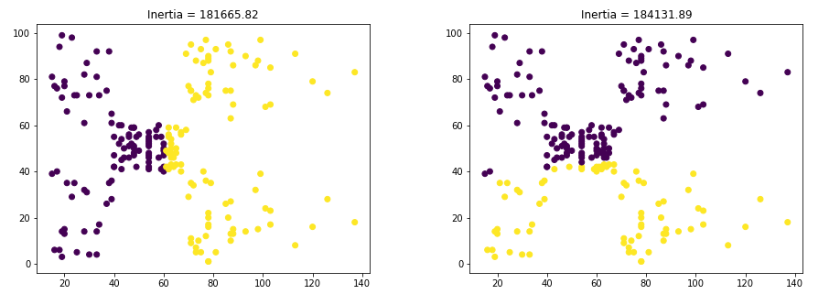
As we have seen above, the k-means clustering model created different clusters for the same data when we change the random state. so, how we will know which cluster is more accurate? Well, in such cases inertia helps us. The lower the value ofinertia for a cluster, the more accurate the clusters are. So, let us find the inertia for the clusters
# creating 2 subplots
fig, ax = plt.subplots(1, 2, gridspec_kw={'wspace': 0.3}, figsize=(15,5))

# k-means clustering in python
for i in range(2):
    km = KMeans(n_clusters = 2, init='random', n_init=1, random_state=i)
    km.fit(data)
    ax[i].scatter(x= data.iloc[:, 0], y=data.iloc[:, 1], c= km.labels_)
    #Labeling the axis with inertia values
    ax[i].set_title(f"Inertia = {round(km.inertia_, 2)}");
Output:
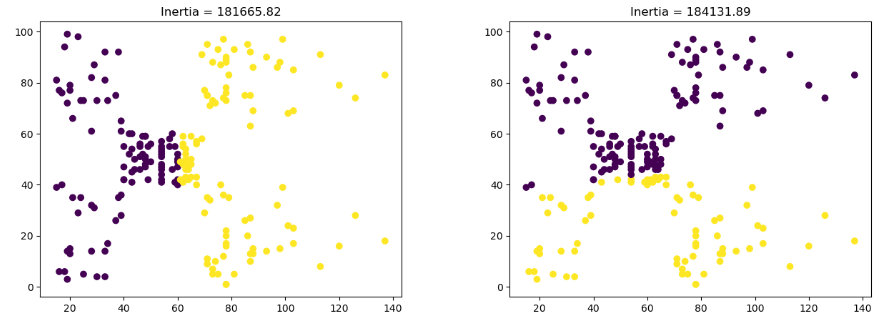
The first plot has a lower value for inertia which means it is more accurate.
How to Find Optimum Clusters in K-means Clustering in Python?
As we discussed earlier, we can use the elbow method to get the optimum number of clusters in k-means clustering. Let us plot the elbow method on our dataset and find the optimum number of clusters.
#WCSS of clusters
wcss = []

# using for loop to iterates
for i in range(2,15):

    #training k-means clustering in python on different clusters
    km = KMeans(n_clusters= i)
    km.fit(data)
    wcss.append(km.inertia_)

# ploting the elbow graph
plt.plot(range(2,15), wcss, 'og-')
plt.annotate('optimum clusters', xy=(5, 50000), xytext=(6, 100000), arrowprops=dict(facecolor='blue', shrink=0.05))

# labeling the data
plt.xlabel("Number of clusters")
plt.ylabel("Inertia");
Output:
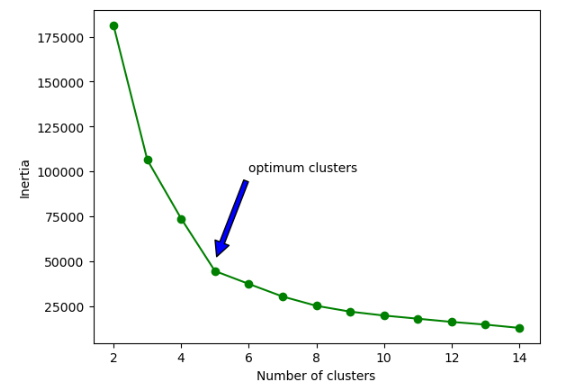
The elbow method shows that 5 is the optimum value for clusters.
K-means Clustering With 5 Clusters
Let us now train the model again with 5 clusters.
# importing the k-means
from sklearn.cluster import KMeans

# initializing k-means clustering in Python with two clusters
km = KMeans(n_clusters = 5)

# training the k-means clustering in Python
km.fit(data)

# ploting the graph of the clusters
plt.figure(figsize=(10,5))
plt.scatter(x= data.iloc[:, 0], y=data.iloc[:, 1], c= km.labels_)
plt.xlabel('Annual Income (k$)')
plt.ylabel('Spending Score (1-100)');
Output:
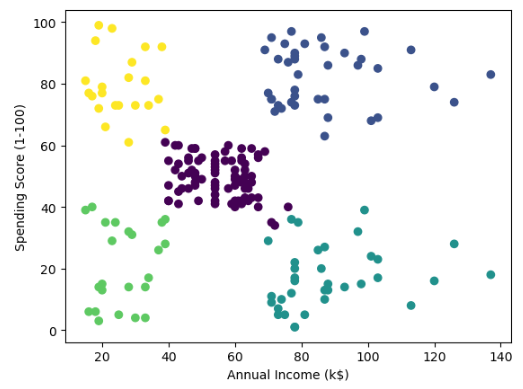
The dataset has been split into 5 different optimum clusters.
Finding Optimum Clusters
We found the optimum number of clusters which is 5. In this section, we will use inertia to get the optimum cluster locations. As we have seen before as we change the random state the position of clusters also changes. So let us find the optimum position for clusters.
# creating 2 subplots
fig, ax = plt.subplots(1, 5, gridspec_kw={'wspace': 0.3}, figsize=(15,5))

# k-means clustering in python
for i in range(5):
    km = KMeans(n_clusters = 5, init='random', n_init=1, random_state=i)
    km.fit(data)
    ax[i].scatter(x= data.iloc[:, 0], y=data.iloc[:, 1], c= km.labels_)
    #Labeling the axis with inertia values
    ax[i].set_title(f"Inertia = {round(km.inertia_, 2)}");
Output:

As you can see, we have the lowest inertia value when the random state is either 0 or 1.
Summary
K-means clustering is a method used for clustering analysis, especially in data mining and statistics. It aims to partition a set of observations into a number of clusters (k), resulting in the partitioning of the data into Voronoi cells. In this article, we discussed how k-means clustering works. We also learned how to get the optimum number of clusters using the elbow method. Moreover, we implemented k-means clustering in Python on a real dataset.