Matplotlib is a Python module that is mostly used for the visualization and plotting of various graphs. It provides many useful methods that help us with data analysis and finding hidden trends with graphs. The advantage of using Matplotlib for visualization is that it gives more customization options. We can change the labeling, font size, color, and many others. In this short post, we are going to learn how we can change font size in Matplotlib module. We will take various examples.
How to Change the Font Size in The Matplotlib Module
Before going to start changing the font size, make sure that you have already installed the matplotlib module on your system. It is not Python built-in module so you need to install the module. Use the pip command to install the module:
# install the module
pip install matplotlib
Once the installation is complete, import the module and run the Python script.
# importing the module
import matplotlib.pyplot as plt
If this does not return any error, that means you have installed the module on your system.
Example: Change Font Size
As we said earlier the Matplotlib module gives more power to the user by giving more customization options. There are various methods available to change the font size some of which we will discuss here:
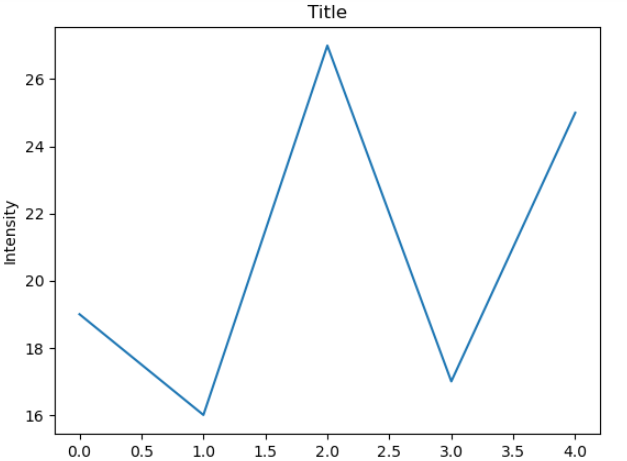
First, let us create a simple plot:
import random

# creating the dataset
y= random.sample(range(10, 30), 5)
x = [i for i in range(5)]

# plotting a plot
plt.plot(x, y)

plt.title('Title')
plt.xlabel('Time')
plt.ylabel('Intensity')
plt.show()
Output:
Now, let us make the font size bigger as they are in their default size.
# plotting a plot
plt.plot(x, y)

plt.title('Title', fontsize = 30)
plt.xlabel('Time', fontsize=20)
plt.ylabel('Intensity', fontsize=20)
plt.show()
Output:
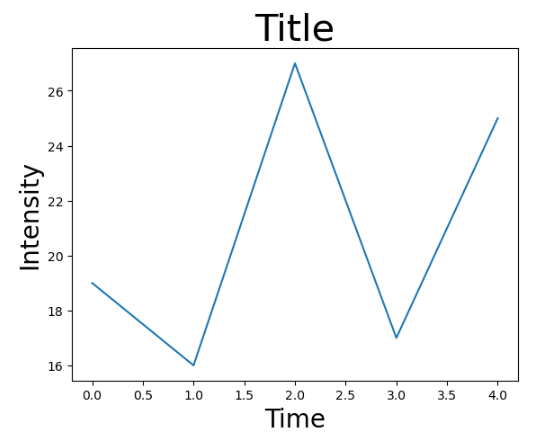
As you can see, we have made the font size bigger. You can adjust accordingly by changing the value.
Example: Change Font Size Using rcParams.update()
Another popular way to change the font size is using the rcParams.update() method. Let us see how it actually works.
# setting font sizeto 30
plt.rcParams.update({'font.size': 60})
# plotting a plot
plt.plot(x, y)

# setting title name
plt.title("Title")

# setting x axis label
plt.xlabel("Time")

# setting y axis label
plt.ylabel("Intensity")

plt.show()
Output:
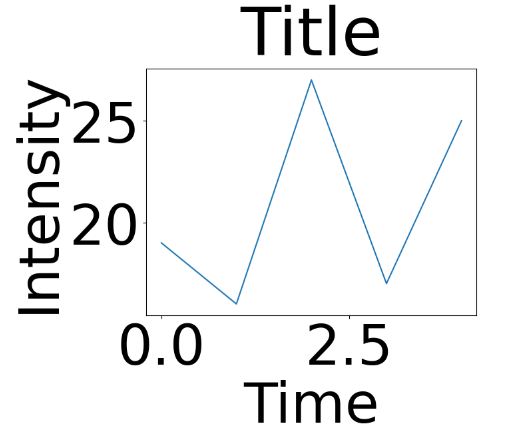
As you can see, we were able to change the font size of the plots in the Matplotlib module successfully.
Features of Matplotlib Module
- It can be used to plot various graphs
- Line plot
- Bar plot
- Scatter plot
- Pie plot
- Histogram
- Box plot
- Heatmaps
- Contour Plots
- 3D plots
- Error Bar
- Subplots
- Pair plots
- And many more
- Annotation
- Legends
- Customization
- Transparency
- Scaling
- Interactive plots
- Controlling labels
- Change font size
- Change color
- Change the size of the plot
- Saving plots
- Reading images
- Grids
- And many more features
Conclusion
Here we discussed the two most common ways to of changing the size of the font in Matplotlib modules. Sometimes, to make the plot looks more concise with the styling, we need to customize it a little bit. The Matplotlib module provides good customization as we discussed here