One of the simplest and easiest supervised machine learning models is Linear Regression. It is commonly used for regression datasets. Based on the linear relation between the input and the output values, the linear regression model helps us to predict the output values. Here, we will learn the basic concepts of linear regression and implement using sklearn module.
What is the Linear Regression Model?
A Linear Regression model is a supervised machine learning model used to predict continuous values. We know supervised machine learning is mostly used to make some predictions. These predictions can be categorical or continuous. A linear regression is a continuous model.
The mathematical formula of the regression model is:
y = mx + b
- y is the output value
- m is the slope
- x is the input value
- b is the y-axis intercept
When we train the linear regression model, it will use this formula to find out the best-fitted line and will use the same line to make future predictions.
How to implement the Linear Regression model?
Not only a linear regression model but there are simple 5 steps to implement any supervised machine learning model.
- Import the dataset and preprocess the data
- Divide the data into input and output values
- Split the data into training and testing parts
- Train the model
- Validate the model
These are simple 5 steps to implement any supervised machine learning model. We will go through these 5 steps and see how to implement the linear regression model.
Import dataset and preprocess
In this case, we will use a very simple dataset which is about the total_sqft and price for the construction. So, based on the area of the land, we have to develop a linear regression model that can predict the approximate price.
As the dataset is in CSV format, we can use the pandas to open the file.
# import the dataframe
import pandas as pd

# dataset
data = pd.read_csv('data.csv')
Whenever you get the dataset before applying any supervised machine learning models always check for two preprocessing steps.
- Check for missing values ( Previous lesson )
- Check for non-numeric values (Previous Lesson )
The reason for mandatory checking for these two preprocessing steps is that if your dataset has missing values or non-numeric columns, the machine learning model will not be able to train on the dataset and will return an error. In our case, the dataset is clean dataset and there is no need for any preprocessing steps. However, there might be some outliers in our dataset which you can handle before training the model.
Divide the dataset
There are actually two types of splitting for supervised machine learning before training the model.
First is the splitting of the data into input and output values.
# input and output values
x = data.drop('price', axis=1)
y = data.price
The next type of splitting is the training and testing.
from sklearn.model_selection import train_test_split
X_train, X_test, y_train, y_test = train_test_split(x, y, test_size=0.25)
We had discussed this splitting in detail in our previous lesson.
Training the Linear Regression Model
In case of all supervised machine learning models, the fit() function is used to train the model. The training of model means giving the model enough time and data to find the relation between the input and the output values from the training part of the dataset.
from sklearn.linear_model import LinearRegression
model = LinearRegression()
model.fit(X_train, y_train)
In this part of the code, we imported the model. Then we initialized the model and stored the model in a variable named model. The last line is the training of the model. The fit() function takes the input and output values of the training data so that the model will go through this dataset and find the best-fitted regression line for us.
Validate the model
There can be various methods and metrics available to check the performance of the model. One way is to see how the model has behaved on the training dataset. We can see the best-fitted regression line visually.
import matplotlib.pyplot as plt
plt.scatter(X_train['total_sqft'], y_train)
plt.plot(X_train['total_sqft'], model.predict(X_train), c='r')
plt.show()
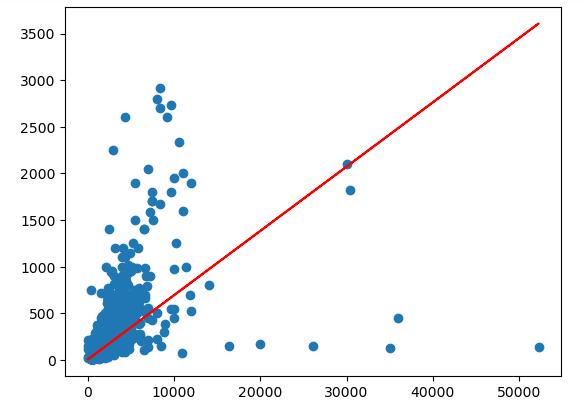
In this part of the code, we imported the matplotlib module. Then we visualized the training data using the scatter plot. In the second plot, we plotted a line chart for the best-fitted regression line, again for the training dataset. This shows us how the model has fitted on the training dataset. The same regression line will be used to make predictions later.
Let us now check how the model performs on the testing dataset. For that, we first need to make a prediction about the price using the input values of the testing data and then we will compare those predictions with the actual price values in the testing data.
# make prediction
model_pred = model.predict(X_test)
# show prediction and actual values on the chart
plt.plot([i for i in range(len(y_test))], y_test, label='actual')
plt.plot([i for i in range(len(y_test))], model_pred, label='predicted')
plt.legend()
plt.show()
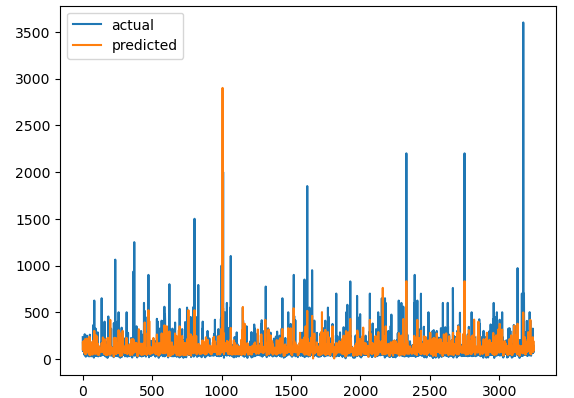
This shows a comparison chart of the actual price values and predicted price values of the model. This seems to be good but not the best. We can also find the r2_score to verify the results.
from sklearn.metrics import r2_score
r2_score(y_test, model_pred)
0.29751332137559994
The r2_score is quite low which suggests that the model is not good. This can be because of the outliers in the dataset or because the model is underfitted. Later in upcoming lessons, we will learn how to do the hyperparameter tuning of the model to increase the performance.
If you are still confused about the linear regression, we will highly recommend you to read a more comprehensive implementation of the Linear Regression model with hyperparameter tuning as well.