An outlier is a data point that is too far away from the other datasets. This can be one data point or a group of data points. Usually, an outlier in the dataset is because of human error, scraping error or context of the dataset. It is highly recommended to handle outliers before analyzing or applying a machine-learning model to the dataset as outliers can give us false information. This lesson will teach us how to handle outliers using normal distribution rules.
What is an outlier in Dataset?
An outlier is a data point that is too far away from the actual data points and changes the general trend of the dataset. As mentioned earlier, the causes of outliers include human errors while storing data, scrapping errors, or dataset context. In such a scenario, when the overall trend of the data is changed by a few data points, we should detect those points and then handle them correctly.
Why handle outliers in a dataset?
Before moving to understand how to find outliers in our dataset, let us first find out why it is necessary to handle outliers in our dataset.
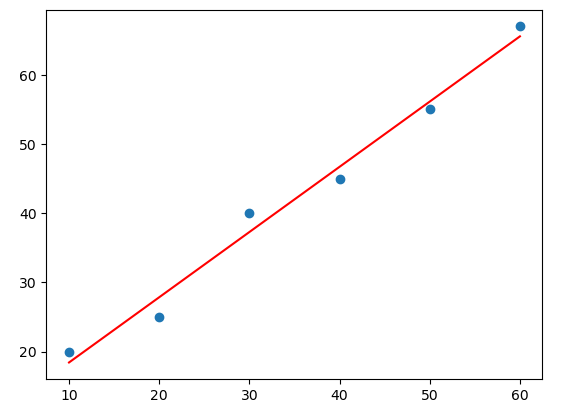
For this purpose, we will create simple colinear data and then find the best-fitted regression line for it.
import pandas as pd
import numpy as np
import matplotlib.pyplot as plt

# create dataframe
data = [[10, 20], [20, 25], [30, 40], [40, 45], [50, 55], [60, 67]]

# convert to dataframee
data = pd.DataFrame(data, columns = ['Input', 'Output'])

# find the slop and y intercept
m, b = np.polyfit(data['Input'], data['Output'], 1)

# plot scatter and line chart
plt.scatter(data['Input'], data['Output'])
plt.plot(data['Input'], m * data['Input'] + b, c='r')
plt.show()
Output:
Let us now understand the code:
- First, we imported all the necessary Python modules
- Then we created a simple data frame with input and output values. We tried our best to have a linear relation between input and output values.
- Then, we used the numpy module to find the slope (m) and y-intercept (b) using the ployfit() function.
- Once we have these values, we can then easily calculate the best-fitted regression line using y= mx + b. We plotted this formula using the line chart.
Now, let us just assume that our dataset has one outlier. We will change one of the output values to some negative values and will re-run the code again. You will notice a huge difference in the slop of the best fitted line.
# create dataframe with an outlier
data = [[10, 20], [20, 25], [30, 40], [40, 45], [50, -55], [60, 67]]

# convert to dataframee
data = pd.DataFrame(data, columns = ['Input', 'Output'])

# find the slop and y intercept
m, b = np.polyfit(data['Input'], data['Output'], 1)

# plot scatter and line chart
plt.scatter(data['Input'], data['Output'])
plt.plot(data['Input'], m * data['Input'] + b, c='r')
plt.show()
Output:
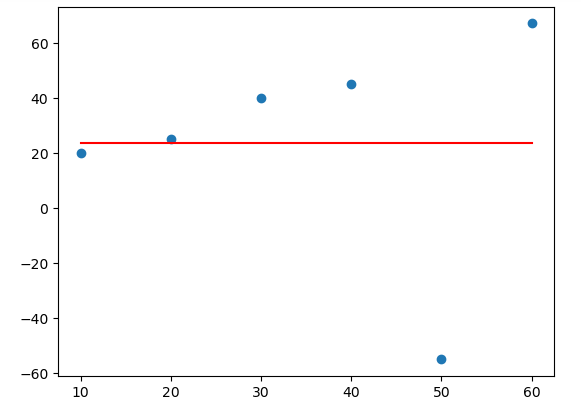
The only thing that we changed was making one output negative (an outlier) and it highly affected the overall trend of the data points. Imagine if you have a large data set and a high number of outliers in your data. It may affect the overall trend and may give you false information. That is the reason, it is necessary to handle outliers.
How do we detect outliers in a data frame?
In Python, there are various methods available that can help us to detect outliers in our dataset. It is necessary that we handle outliers in the target column or any other column that has a high contribution to the output values.
Once you figured out the column, then the next step will be to check if the specified column has outliers or not.
In this case, we will use a simple data frame about the house price and check whether the price column has outliers.
import pandas as pd
data = pd.read_csv("house.csv")
- Scatter plots can be helpful to check for outliers. When plotting a scatter chart for the outliers, make sure that on your x-axis, you are plotting the index values so that you can see the actual price values on the y-axis.
# import seaborn module
import seaborn as sns

sns.scatterplot(data, x=data.index, y=data.price)
Output:
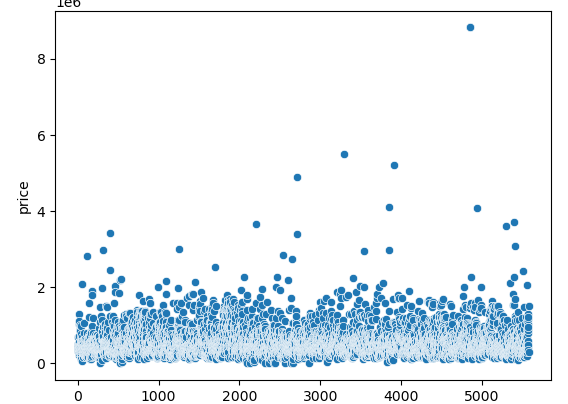
We can see that some data points are too far away from the majority of the data points. This suggests that our data has some outliers in the price column.
- The second method to check for outliers is using a box plot. A box plot is a simple plot that will give us information about the distribution of the dataset.
# box plot
sns.boxplot(data['price'])
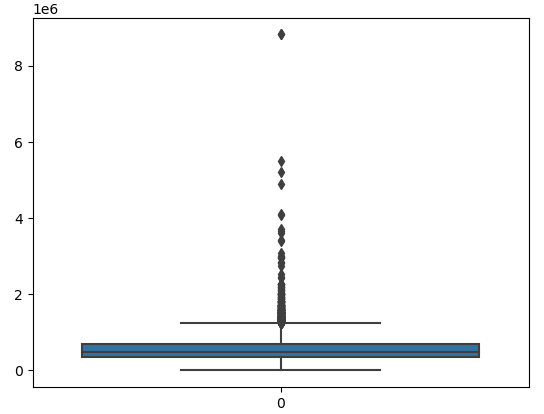
The upper line and the lower lines are the upper and lower limits of the boxplot known as whiskers. Any data point that is above or below these whiskers is an indication of outliers. In our case, we can see a lot of data points above the upper whisker which simply means, we have outliers in the price column.
- The Violin plots also can give us information about the outliers. If your violin plot has a long tail, it can be an indication of the outliers.
sns.violinplot(data['price'])
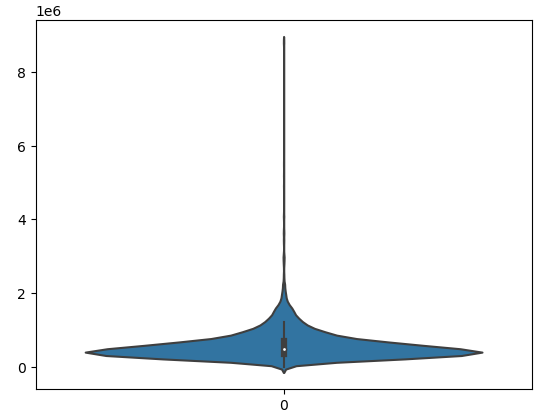
The long tail of the violin plot suggests that our data has some outliers and we need to handle them properly.
Handle outliers in Python?
Before handling the outliers, we need to understand the rules of a normal distribution as we can use the normal distribution method to handle outliers. However, there are more optimum methods to handle outliers such as RANSAC or Isolation forest, which we will discuss in our upcoming lessons.
Note: This image is from Scribbr’s Website.
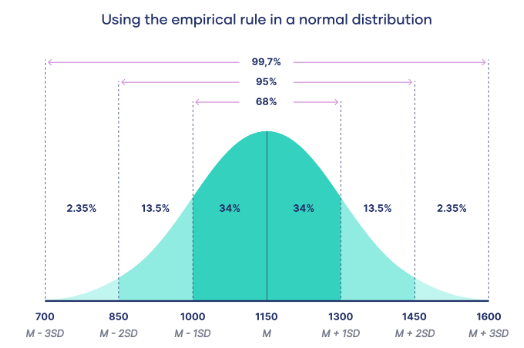
According to the rules of normal distribution:
- If we move one standard deviation to the left and one standard deviation to the right side of the mean, we cover 68% of the dataset.
- If we move two standard deviations to the left and right sides from the mean of the dataset, we cover 95% of the dataset
- And if we move 3 standard deviations to the left and right side from the mean, we actually cover 99.7% of the dataset.
We will take the third rule and assume that any data point that is 3 standards away from the mean of the dataset will be an outlier.
To implement this rule on our dataset, we first need to find the two most important values; Mean and standard deviation of the price column.
import numpy as np
data_mean = np.mean(data['price'])
data_std = np.std(data['price'])
Once we have calculated the mean and standard deviation of the dataset, then we can use the 3rd rule of the normal distribution to find out how many data points are outside the 3 standard deviations from the mean.
cut_off = data_std * 3
lower = data_mean - cut_off
upper = data_mean + cut_off
The cut_off is the range and lower and upper are the lower and upper limits. Now, we will tell Python that any data point that is lower than the lower limit or greater than the upper limit is actually an outlier.
outlier = []
# check each data point
for i in data['price']:
if i > upper or i < lower:
outlier.append(i)
We created a new empty list for outliers and checked if any data point in the price column is less than the lower limit or greater than the upper limit, we added that data point to the outlier list.
In our case, the method detected a total of 63 values as an outlier. Now, things become simpler. We can directly go to the data and remove those points which are detected as an outlier.
But before removing, let us first confirm that the data points that our method has detected as outliers are actually outliers.
data['outlier'] = data['price'].isin(outlier)
sns.scatterplot(data= data, x=data.index, y='price', hue='outlier')
We added the outliers back to the data frame and created a new column named Outlier. Then, we used the scatterplot to show the price column and color the normal data and outliers differently.
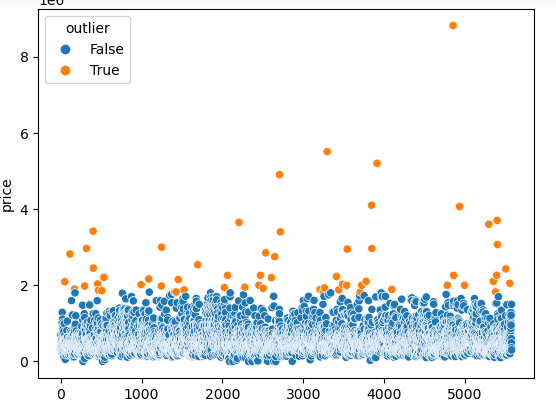
Now we are sure that the data points that were detected as outliers by the normal distribution method are actually outliers.
Let us simply remove the outliers from our dataset.
# dropping the outliers
data.drop(data.price[data.price < lower].index, inplace=True)
data.drop(data.price[data.price > upper].index, inplace=True)
Now, our dataset will be clean. Check the dataset and visualize the price column using a boxplot or scatter plot after removing the outliers.