Matplotlib subplots in Python

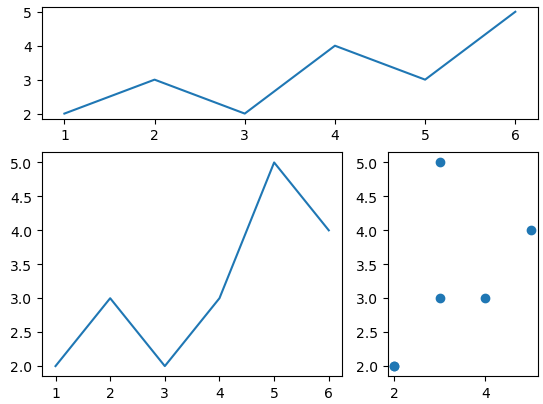
subplotting with different sizes

Matplotlib subplots are a plot that allows the users to plot various charts in one graph as subplots. We know that Matplotlib is a Python module commonly used for data visualization. In some cases, we may be required to plot not just a chart but subplots of charts. In such cases, we can simply use … Read more

Data Visualization Using Pandas – Line Chart, Box Plot, Pie Plot

data visualization

Are you looking for Data visualization using Pandas? Here we will plot various graphs using the pandas module. Pandas is an open-source library in Python. It provides ready-to-use high-performance data structures and data analysis tools. Pandas module runs on top of NumPy and it is popularly used for data science and data analytics. However, data … Read more

Create Hexagon in OpenSCAD – Fully Explained

OpenSCAD is a free software application for creating solid 3D computer-aided design objects. In this tutorial, we will learn how we can create a hexagon in OpenSCAD using different methods. Before going to the implementation part, we assume that you have basic knowledge of how to use OpenSCAD and draw some basic shapes. Here we … Read more