Sklearn KNN algorithm is a supervised and lazy learning algorithm mainly used to handle classification problems. It is easy to implement and understand but has the major drawback of becoming significantly slow as the size of that data in use grows. It can be used for binary and multi-class classification. Sklearn KNN algorithm is known as a lazy machine learning algorithm because each time we run the trained model, each time it is going to calculate the distances again and find the K nearest neighbors.
In this article, we will learn how the Sklearn KNN algorithm works and how we can implement it on a classification dataset. Moreover, we will also use various evaluation matrices to evaluate the model.
What is the KNN Algorithm?
The Sklearn KNN algorithm also known as the K-nearest Neighbour algorithm is a lazy learner and non-parametric Supervised Learning algorithm. It is a Lazy learner because it doesn’t learn a discriminative function from the training data but memorizes the training dataset instead. There is no trained model for KNN. In fact, each time we run the algorithm, it each time processes the entire model to provide the output.
You might also like to read about PCA and LightGBM.
Also, the Sklearn KNN algorithm is non-parametric. The term is non-parametric refers to the absence of any assumptions about the underlying data distribution. This will be useful in practice, as most real-world datasets do not adhere to mathematical theoretical assumptions.
The K-nearest neighbor algorithm can be used to make predictions for both binary classification datasets and multi-class classification datasets. Binary classification is a classification type with only two possible output classes. For example, True or False, 0 or 1, Yes or No, and many more. In such classification, the output data set will have only two discrete values representing the two categories/classes. While Multi-class classification is again a type of classification with more than two output classes. There will be more than two discrete values in the output in such a classification. For example, classifying different animals, predicting the grades of students, and many more
How Does KNN Work?
The concept of finding nearest neighbors may be defined as the process of finding the closest point to the input point from the given data set. The algorithm saves all available cases (test data) and categorizes new cases based on the majority votes of its K neighbors. The initial step in developing KNN is to convert data points into mathematical values. The algorithm works by finding the distance between the mathematical values of these points. It calculates the distance between each data point and the test data, then determines the probability of the points being similar to the test data.
The distance function in KNN might be the Euclidean, Minkowski, or Hamming distance. Among these, Euclidean is the most popular and simple one.
The KNN algorithm uses the distance formula to find the shortest distance between the input and training data points. It classifies the input data point. Then it selects the k-number of shortest distances based on the majority voting.
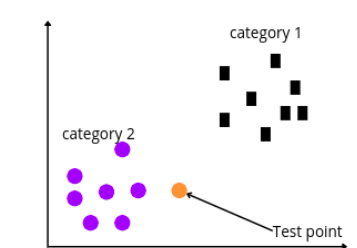
The KNN algorithm classifies the new data points based on their nearest neighbors. For example, we have a new data point, and we need to classify it using the KNN algorithm.
The Sklearn KNN algorithm will now calculate the distance between the test and other data points. Then based on the K value, it will take the k-nearest neighbors. For example, let’s use K = 3.
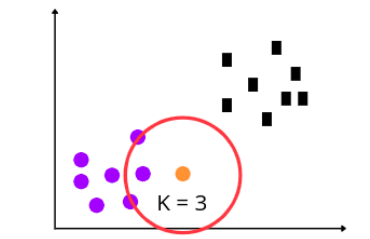
As we have specified the K value 3, the algorithm will take the three nearest neighbors and classify the test point based on the majority voting. In our case, there were three circles when the K = 3, which means the test point will be classified as a Circle.
Why the Value of K Cannot be an Even Number?
While selecting the value of K, you should be very careful. And always select an odd number for the K value. The reason why selecting an even number can be worse is we might have a tie between the classes. For example, let’s say we select the value of K as 4, but what will happen if the voting for the output classes will be 2, 2? Then the algorithm will fail to give output as the number of votes has been tied.
When we have assigned the value of K as 4, then the voting for each class is 2. This means there is no class with majority voting and the KNN algorithm predicts the output class based on the majority voting. So, to avoid any confusion, it is always recommended to have an odd number for the value of K.
Implementation of the Sklearn KNN Algorithm
Now, we will implement the K-nearest neighbor algorithm on a binary dataset using sklearn module, and will then evaluate the model as well. You can access the dataset and Jupyter Notebook from my Github account. In this section, we will step by step explain each part of the implementation.
Before going to the implementation part, make sure that you have installed the following required modules as we will be using them later.
- sklearn
- pandas
- NumPy
- matplotlib
- seaborn
- chart_studio
- plotly
You can use the pip command to install the required modules.
Importing and exploring the dataset
Now let us first import the dataset using the pandas module.
# import pandas module
import pandas as pd
# importing the dataset
data = pd.read_csv('dataset.csv')
The dataset contains information about the age and salary of a person and whether they purchased the term or not. Let us find the number of output classes using the unique() method.
# finding the unique value
data['Purchased'].unique()
Output:
array([0, 1])We have only two output categories which means the dataset is binary classification.
Splitting the dataset
Now, we will split the dataset. First, we will divide the dataset into input values and the target variable.
# dividing the dataset
X = data.drop('Purchased', axis=1)
y = data['Purchased']
We will now split the dataset into testing and training parts so that we can use the training part to train the model and then the testing part to evaluate the performance of the model. We will use sklearn module to split the dataset. We will also assign a value of 0 to the random state.
# importing the train_test_split method from sklearn
from sklearn.model_selection import train_test_split
# splitting the data
X_train, X_test, y_train, y_test = train_test_split(X, y, test_size=0.30, random_state=0)
As you can see, we have assigned 30% of the data to the testing and 70% to the training part.
Feature Scaling the Dataset
Feature Scaling is a technique for bringing down the values of all the independent features of our dataset on the same scale. In simple words, feature scaling is a technique to standardize the independent features present in the data in a fixed range. If feature scaling is not done, a Machine Learning algorithm will assume larger values to have more weight and smaller values to have less weight, regardless of the unit of measurement.
Let us apply feature scaling to our dataset.
# applying standard scale method
from sklearn.preprocessing import StandardScaler
sc = StandardScaler()
# scaling training and testing data set
X_train = sc.fit_transform(X_train)
X_test = sc.transform(X_test)
Now our dataset is fully ready and we can use it to train the model.
Training the Sklearn KNN model
First, we need to import the KNN model and initialize it.
# importing sklearn knn classifier
from sklearn.neighbors import KNeighborsClassifier
# K value set to be 3
classifer = KNeighborsClassifier(n_neighbors=3 )
As you can see, we have initialized the model with the K value of 3.
Let us now train the model using the training dataset.
# model training
classifer.fit(X_train,y_train)
Once the training is complete, we can then move to the predictions parts.
Making predictions using the KNN model
Let us say someone has an age of 25 and a monthly salary of 25000 and we want to know if this person will purchase the term or not. So, we can use our model to give us the predicted value.
# making predictions
classifer.predict([[25, 2500]])
Output:
array([1])
The model returns 1, which means this person will purchase the product. But we are not sure how accurate this prediction is. So, in order to know how accurate the predictions of the model are, we need to evaluate the model using testing data.
First, let us predict the output values using the testing data.
# making predictions
y_pred = classifer.predict(X_test)
Now we will go to the evaluation part.
Evaluating the KNN model
First, we will use a confusion matrix to summarize the actual and predicted values. All the values in the main diagonal of the confusion matrix will show the correct classification and any value outside the main diagonal represents the incorrect classification.
# importing seaborn
import seaborn as sns
# Making the Confusion Matrix
from sklearn.metrics import confusion_matrix
# providing actual and predicted values
cm = confusion_matrix(y_test, y_pred)
# If True, write the data value in each cell
sns.heatmap(cm,annot=True)
As you can see, this shows our model was able to classify most of the items correctly.
Let us also find the accuracy score of the model.
# importing accuracy score
from sklearn.metrics import accuracy_score
# printing the accuracy score
accuracy_score(y_test,y_pred)
Output:
0.84848484848484
This shows that our model was able to predict 84% of the testing data correctly.
How to Find Optimum K Value in the KNN Algorithm
There are various ways to find the optimum K value in the KNN algorithm. Here we will discuss the most efficient and popular one. We will use the error rate graph to find the optimum value for K. In the error rate graph, the lowest point in the graph will be the optimum value of K for the specific dataset.
# import numpy
import numpy as np
error_rate = []
# searching knn search value upto  40
for i in range(1,40):
    # knn algorithm
    knn = KNeighborsClassifier(n_neighbors=i)
    knn.fit(X_train, y_train)
    # testing the model
    pred_i = knn.predict(X_test)
    error_rate.append(np.mean(pred_i != y_test))
# Configure and plot error rate over k values
plt.figure(figsize=(10,4))
plt.plot(range(1,40), error_rate, color='blue', linestyle='dashed', marker='o', markerfacecolor='red', markersize=10)
#plotting knn graph
plt.title('Error Rate vs. K-Values')
plt.xlabel('K-Values')
plt.ylabel('Error Rate')
Output:
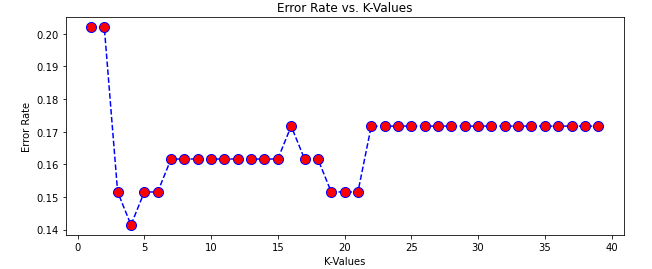
As you can see, we get the lowest error when the value of K was 4. So, 4 is the optimum value for the K.
Training the KNN Model Using the Optimum K Value
Now, we will use the optimum value for K to train the model, test it and find out the accuracy score.
# K value set to be 3
classifer = KNeighborsClassifier(n_neighbors=4 )
# knn in python
classifer.fit(X_train,y_train)
# making predictions
y_pred = classifer.predict(X_test)
# printing the accuracy score
accuracy_score(y_test,y_pred)
Output:
0.865
Summary
The K-Nearest Neighbors algorithm computes a distance value for all node pairs in the graph and creates new relationships between each node and its k-nearest neighbors. It is also a lazy learner as the model is not trained for long-term use. Each time we run the algorithm, it trains itself and computes results. In this article, we discussed how the sklearn KNN algorithm works and how we can find the optimum value for K.