
Are you looking to plot interactive 3d plots in Python? Stay with us and we will explore various methods to have interactive 3d plots in Python.
3D plots are used to plot data points on three axes in an attempt to show the relationship between three variables. Each row in the data table is represented by a marker whose position depends on its values in the columns set on the X, Y, and Z axes. In this article, we will discuss various kinds of 3D plots and visualize them using Plotly and matplotlib modules.
3D Plots in Python Using Matplotlib
Matplotlib was initially designed with only two-dimensional plotting, but with the updates, they include 3D plots as well. Before going to the implementation part, make sure that you have installed the following required modules.
Let us now import the required modules. Learn How to Create a Rainbow in Python
# importing the matplotlib module
import matplotlib.pyplot as plt

# importing 3d ploting
from mpl_toolkits.mplot3d import Axes3D
Once you import the required modules, we can then move to the practical and visualization part. You can access the source code and all the datasets from my GitHub account.
Plotting a Single Point in a 3D Plot Using Matplotlib
We will start the 3D visualization from the very beginning. First, we will just create the 3D figure and axes.
# fixing the size of the plot
fig = plt.figure(figsize=(9,9))

# creating 3D space
ax = fig.add_subplot(111, projection='3d')
Output:

We have successfully created a 3D space. Now, let us plot a point in this space.
# fixing the size
fig = plt.figure(figsize=(9,9))

# plotting the 3d space
ax = fig.add_subplot(111, projection='3d')

# plotting the points
ax.scatter(5,6,7)
plt.show()
Output:
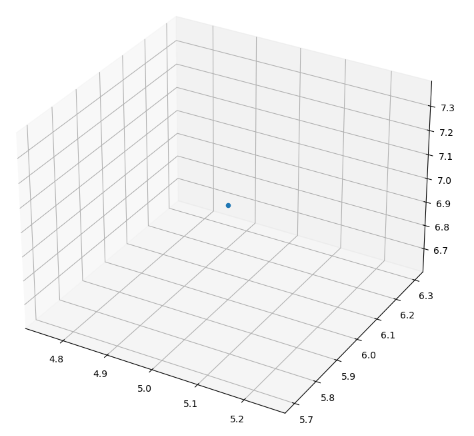
We have successfully plotted the point in the 3D space.
3D Line Plot Using Matplotlib
Now, we will create a function for a continuous line and then plot it on the 3D plot using matplotlib. Let us first create a random function for the line.
# importing the module
import numpy as np

# creating x axis data
x = np.linspace(-4*np.pi,4*np.pi,100)

# creating y axis data
y = np.linspace(-4*np.pi,4*np.pi,100)

# creating z axis data
z = x**5 + y**7
Now, let us plot the line that we just created in a 3D space.
# fixing the size
fig = plt.figure(figsize=(9,9))

# plotting the 3d space
ax = fig.add_subplot(111, projection='3d')

# plotting the points
ax.plot(x,y,z)
plt.show()
Output:

Very simply, we were able to inject the line in the three dimensional space.
3D Contour Plot Using Matplotlib
A contour plot is a graphical technique for representing a 3-dimensional surface by plotting constant z slices, called contours, in a 2-dimensional format. We will first create a function that defines the axes and then will plot in the 3D space.
# function to return a function
def f(x, y):
   return np.sin(np.sqrt(x + y ** 3))

# creating x and y
x = np.linspace(-50, 10, 50)
y = np.linspace(-50, 10, 50)

# using meshgrid function for x and y
X, Y = np.meshgrid(x, y)

# calling the function
Z = f(X, Y)
We have created a random function for the demonstration purpose. Let us now visualize this function using a contour plot.
# plotting the graph
fig = plt.figure(figsize=(8, 8))

# plotting conter plot
ax = plt.axes(projection='3d')
ax.contour3D(Y, Z, X, 50)
ax.set_title('3-D contour plot')

#showing 3D plots in python
plt.show()
Output:

We have successfully plotted the contour plot of the dataset. When you are plotting the contour plot of your own dataset, make sure that the z-axis contains the dataset in 2d array form.
3d Wireframe Plot Using Matplotlib
Wireframe plot takes a grid of values and projects it onto the specified three-dimensional surface, and can make the resulting three-dimensional forms quite easy to visualize. Let us plot the same function using a wireframe plot. Check Sklearn One Hot Encoder Examples (Single and Multiple Columns)
# fixing the size
fig = plt.figure(figsize=(8,8))

# creating 3d space
ax = plt.axes(projection='3d')

#wirefram plot
ax.plot_wireframe(Y, Z, X, color='purple')
ax.set_title('Wireframe plot')

#showing 3D plots in python
plt.show()
Output:
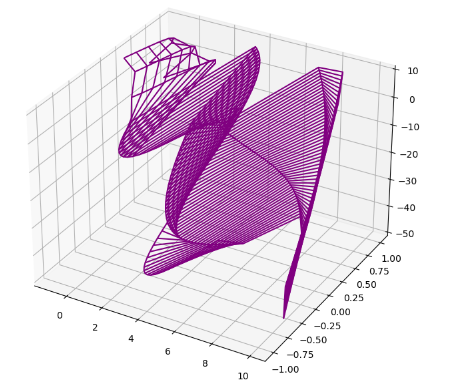
As you can see, we have successfully plotted the wireframe plot of the given function.
3D Surface Plot Using Maplotlib
A surface plot is a three-dimensional wireframe graph that is useful for establishing desirable response values and operating conditions. A surface plot contains the following elements: Predictors on the x- and y-axes. A continuous surface that represents the fitted response values on the z-axis. Now, we will plot the same function on a surface plot as well.
# size of the 3-d plot
fig = plt.figure( figsize=(8, 8))
ax = plt.axes(projection='3d')

# surface plot
ax.plot_surface(Y, Z, X, color='purple')
ax.set_title('Surface plot')

#showing 3D plots in python
plt.show()
Output:

Summary
3D plots in Python are plots that show the data in three different directions/coordinates. In this tutorial, we learned various techniques to visualize data in 3D plots using Matplotlib and Plotly modules.